


Support and Resistance in Forex
Support and Resistance in Forex
Support and Resistance is the new blog post. and I will teach you, how to draw support and resistance zones, on my style.
what are support and resistance
when we are trading, we need to identify the specific area to buy a currency. after doing fundamental and sentiment analysis, we are talking about these zones under technical analysis. this zone or levels are used to find a reversal, breakout point.
why support and resistance levels are different by the trader.
as a scalper, interday, swing, and position trader in the forex market, timeframes should be different charts that, we drawing supply and demand zones. because scalper trader trades for few pips. so he needs to draw the zones one small timeframe. and position trader hopes big pips. so he needs to analyze and draw the levels on the big timeframe.
Remember, Most Important The Support and Resistant is not a singled out number at all. it can be identified as a distinctly identifiable range. In most cases, you see, we are going to pick up Support and Resistant and always go back.
So, how can we know exactly if Support and Resistance will be brake or not? In fact, it does not have a 100% correct answer. So don't trust and trade always using support and resistance level. as we talked before from the main guide we need to focus this analysis type after doing fundamental and sentiment analysis.
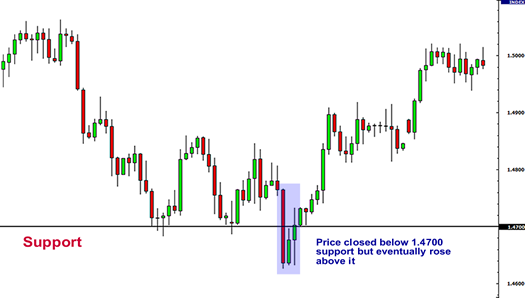
In our example, we can see that Market Price 1.4700 was broken and moved up again. In this case, if we placed a sell trade Definitely, we have a big loss.
A few hours later, we can see that support level was not broken. The Support Level is more powerful than the previous one.
But let's look at it a little longer and wait for you. When MarketPrice raises Spector and Resident's, the Sorrento or the Resistant's area is the only place in the surrounding area without going right up and down. This oscillation is studied by studying the shaft in the candle at Candlestick chart.

If you focus on the above image, the Candle Shaddon is lit to the next one near the Market Layout near 1.4700. At times, we can see that MarketPrice broke up the promotion. But in the aftermath of this, we understand that the promotional campaign has not broken because the comparison was due to the fact that Prism had created the Market in the Market, and that the MarketPlace had been swinging at the same place.
So, how can we know exactly if Support and Resistance will be brake or not? In fact, it does not have a 100% correct answer. So don't trust and trade always using support and resistance level. as we talked before from the main guide we need to focus this analysis type after doing fundamental and sentiment analysis.
We are, for example, the picture we Snapshot, for example, with an image taken a few hours later. Now let's see if the Market Price is 1.4700 Spector Rate and then Candle Closes
In our example, we can see that Market Price 1.4700 was broken and moved up again. In this case, if we placed a sell trade Definitely, we have a big loss.
We have a comparison of the Primer and the Resize value to 1.4700 for example. If we take it as a certain number, we will have to get the Loss to be misinterpreted in this way. so don't draw these lines as a particular number. draw levels as zones.
This is the best way to identify Support and Resistant, Without studying the Candlesticks, and using Line study the Market Chart in the chart {just to identifying the levels}
ලයින් චාර්ට් එකේ එය හදුනා ගැණිමට පහසු වීමට හේතුව ලයින් චාර්ට් එකේ දක්වන්නේ ක්ලෝසින් ප්රයිස් එක පමණක් වීම. කැන්ඩල්ස්ටික් චාර්ට් එකේ ඕපනින් ප්රයිස්, ක්කෝල්සින් ප්රයිස්, හයි ප්රයිස්, ලෝ ප්රයිස්, සියල්ල සදහන් වෙන බැවින් එහි ඇති සංකීර්ණ තාවය නිසා මේ සපෝර්ට් ඇන්ඩ් රෙසිස්ටන්ස් ප්රයිස් Zone එක නිවැරදිව හදුනාගන්න අපහසු වෙනවා. ඒ නිසා සපෝර්ට් ඇන්ඩ් රෙසිස්ටන්ස් Zone එක සොයා ගැනීමට ලයින් චාර්ට් එක භාවිතා කිරීම ඔබට පහසුවක්.
The reason that makes it easy to identify it in the line chart, is that the line chart only shows the Closing Price
පහත රූපය උදාහරණයකට ගෙන ලයින් චාර්ට් එකක සපෝර්ට් ඇන්ඩ් රෙසිස්ටන්ස් Zone එක ඇද ගැණිමේදී.. අදාලා සපෝර්ට් හෝ රෙසිස්ටන්ස් Zone එකේ මාර්කට් ප්රයිස් එක දෝලනය කළ අවස්ථා කීපයක් ගෙන ඒ ඒ අවස්ථාවල මාර්කට් ප්රයිස් එක දෝලනය වූ කුඩා පරාසය තුල ඉහලම සහ පහලම Zone එක සලකුණු කරගැනීමෙන් ඔබට නිවැරදී සපෝර්ට් ඇන්ඩ් රෙසිස්ටන්ස් Zone එකක් ඇද ගත හැකිය.

ෆොරෙක්ස් සපෝර්ට් ඇන්ඩ් රෙසිස්ටන්ස් වල දැනගතයුතු තවත් කරුණු කිහිපයක්
- මාර්කට් ප්රයිස් එක රෙසිස්ටන්ස් Zone එකක් කඩාගෙන ඉහලට ගිය විට එය ඉබේම සපෝර්ට් Zone එකක් බට පත් වේ. සපෝර්ට් ලෙවල් එකක් කාඩගෙන ගිය විට එය ඉබේටම රෙසිස්ටන්ස් Zone එකක් බට පත්වේ.
- වැඩි වැඩියෙන් එකම සපෝර්ට් හෝ රෙසිස්ටන්ස් Zone එකක් අතීතයේ සිට වැඩි වැඩියෙන් මාර්කට් ප්රයිස් එක දෝලනය කර තිබේනම් එය ඉතා ශක්තිමත් සපෝර්ට් හෝ රෙසිස්ටන්ස් Zone එකක් බව හදුනාගත යුතුය.
- සපෝර්ට් හෝ රෙසිස්ටන්ස් ලෙවල් එකක් කඩාගෙන ගිය අවස්ථාවක මාර්කට් ප්රයිස් එක කෙතරම් දුරට ඒ පැත්තටම ගමන් කරයිද යන්න අපට තීරණය කළ හැකි සාධකයක් ඇත. කාලයක් තිස්සේ ශක්තිමත්ව පැවති සපෝර්ට් හෝ රෙසිස්ටන්ස් Zone එකක් බිදගෙන මාර්කට් ප්රයිස් එක ගියේනම් එය විශාල ලෙස එම අතටම මාර්කට් ප්රයිස් එක ගමන් කරන බවට දෙන ඉගියකි. ශක්තියෙන් අඩු අලුත් සපෝර්ට් හෝ රෙසිස්ටන්ස් Zone එකක් නම්. එය සමාන්ය පරිදි ගමන් කරයි .
පහත රූපයෙන් ඔබට ශක්තිමත් සපෝර්ට් ඇන්ඩ් රෙසිස්ටන්ස් සහ කුඩා සපෝර්ට් ඇන්ඩ් රෙසිස්ටන්ස් හදුනාගන්න අකාරය පිළිබදව අවභෝදයක් ගත හැක

මහන්සියෙන් උනන්දුවෙන් පැරණි ෆොරෙක්ස් මාර්කට් තොරතුරු අධ්යනය කර. එක් එක් සපෝර්ට් ඇන්ඩ් රෙසිස්ටන්ස් අවස්ථාවල මාර්කට් එක හැසිරී ඇති ආකරය අධ්යනය කරමින් Demo එකවුන්ට් එකක ටික දවසක් හොදින් පුහුනු වුනොත් ඔබට නිවැර සපෝර්ට් ඇන්ඩ් රෙසිස්ටන්ස් Zone හදුනා ගැණිම අපහසුවක් නොවනු ඇත.
ඊලග පාඩමෙන් ඔබට කීයා දීමට බලාපොරොත්තු වෙන්නේ ෆොරෙක්ස් Trend Line මගින් ට්රේඩ් දමන අකාරය ඉගෙන ගන්නා අකාරය.


niyamai
ReplyDeleteTraders always run into problems with accumulation of data on real time basis. Usually, the trading platforms used may be slow for purpose of updating or they may not have the necessary bandwidth to offer the data required. FXB Trading gives data on real time basis as it takes place and traders are promised a quality trading experience with them.
ReplyDeleteso true. I also agree with you. FXB Trading provides data on the things that a Trader needs and it helps me when I trade.
Deletetraders need experience and knowledge to trading. because that important component on trading. that reason why i am choose FXB Trading as my broker in forex.
ReplyDelete